

Ever wonder how much your monthly household income at your area is compared to another area? (Eg. Bedok vs Jurong) This work is inspired by a seedly article and you may find the code in my github repository.
From datagovsg, URA updates the masterplan every few years and we will be able to get the most recent updated KML file of the Singapore planning area. This will be used for visualising the Household Monthly Income by Planning Area later.
Before that, we need to prepare the dataset from Onemap API!
- 1. Import the required libraries
- 2. Perform Onemap API call to get the list of planning areas dated last year
- 3. Read the csv file
- 4. For loop to perform Onemap API call mutliple times to get the household monthly income from different planning areas
- 5. Read the csv file
- 6. Data cleansing to remove unwanted rows and dirty data
- 7. Summing up columns for better visualisation
- 8. Save the hmi_df to csv file
- 9. Download KML file from datagovsg and convert to GEOJSON file
- 10. Create Shape Map visualizations in Power BI Desktop
1. Import the required libraries
import json
import requests
import pandas as pd
import csv
import datetime
2. Perform Onemap API call to get the list of planning areas dated last year
# Get the current date
current_date = datetime.datetime.now()

# Subtract 1 year from the current year
one_year_ago = current_date - datetime.timedelta(days=365)

# Get the year from the result
year_minus_1 = one_year_ago.year

print(year_minus_1)

url = f"https://www.onemap.gov.sg/api/public/popapi/getPlanningareaNames?year={year_minus_1}"

# insert your own API key
Authorization_key = "Insert your API key"

headers = {'Content-Type': 'application/json',
           'Authorization': Authorization_key,
           'User-Agent': 'Mozilla/5.0'}

# Perform API call to get the list of planning areas dated last year
def get_data():

    response = response = requests.request("GET", url, headers=headers)

    if response.status_code == 200:
        return json.loads(response.content.decode('utf-8'))
    else:
        return None

data_info = get_data()

if data_info is not None:
    print("Success! json dataset to convert to csv is embedded in data_info['Result']")
else:
    print('[!] Request Failed')

#flatten nested data in json file
from pandas.io.json import json_normalize
data = data_info
flattendata = json_normalize(data)

#convert json data to .csv file, removing the index number
flattendata.to_csv('planning_area_list_' + str(year_minus_1) + '.csv', index=False)
Example output:
2022
Success! json dataset to convert to csv is embedded in data_info[‘Result’]
3. Read the csv file
df = pd.read_csv('planning_area_list_2022.csv')
# Remove the first row as it is not relevant
df = df.tail(-1)
4. For loop to perform Onemap API call mutliple times to get the household monthly income from different planning areas
Take note that onemap API is updated every 5 years hence, we are using 2020 data
# insert your own API key
Authorization_key = "Insert your API key"

headers = {'Content-Type': 'application/json',
           'Authorization': Authorization_key,
           'User-Agent': 'Mozilla/5.0'}


def get_data(url):

    response = response = requests.request("GET", url, headers=headers)

    if response.status_code == 200:
        return json.loads(response.content.decode('utf-8'))
    else:
        return None

# for loop to call onemap API with the planning areas gotten from previous list
# take note that onemap API is updated every 5 years hence, we are using 2020 data
for planning_area in df['pln_area_n']:
    url = f"https://www.onemap.gov.sg/api/public/popapi/getHouseholdMonthlyIncomeWork?planningArea={planning_area}&year=2020"
    data_info = get_data(url)
    if data_info is not None:
        print("Success! json dataset to convert to csv is embedded in data_info['Result']")
    else:
        print('[!] Request Failed')

    #flatten nested data in json file
    from pandas.io.json import json_normalize
    data = data_info
    print(data_info)
    flattendata = json_normalize(data)
    flattendata.to_csv('household_monthly_income_' + '2020' + '.csv', mode='a' , index=False)
5. Read the csv file
hmi_df = pd.read_csv('household_monthly_income_2020.csv')
hmi_df = hmi_df.dropna(subset=['total'])
6. Data cleansing to remove unwanted rows and dirty data
# perform data cleansing to remove unwanted rows and dirty data
hmi_df = hmi_df[~hmi_df.planning_area.str.contains("planning_area")]
hmi_df['total'] = hmi_df['total'].astype(int)
hmi_df = hmi_df[hmi_df.total != 0]
hmi_df = hmi_df.reset_index(drop=True)
# convert all the columns' datatype to int except planning_area
for column in hmi_df.columns.tolist():
    if column != 'planning_area':
        hmi_df = hmi_df.astype({column : "int"})
7. Summing up columns for better visualisation
# summing up columns for better visualisation
col_list1 = ['below_sgd_1000', 'sgd_1000_to_1999', 'sgd_2000_to_2999', 'sgd_3000_to_3999', 'sgd_4000_to_4999']
col_list2 = ['sgd_5000_to_5999', 'sgd_6000_to_6999', 'sgd_7000_to_7999', 'sgd_8000_to_8999', 'sgd_9000_to_9999']
col_list3 = ['sgd_10000_to_10999', 'sgd_11000_to_11999', 'sgd_12000_to_12999', 'sgd_13000_to_13999', 'sgd_14000_to_14999']
col_list4 = ['sgd_15000_to_17499', 'sgd_17500_to_19999', 'sgd_20000_over']

hmi_df['sgd_0_to_5000'] = hmi_df[col_list1].sum(axis=1)
hmi_df['sgd_5000_to_10000'] = hmi_df[col_list2].sum(axis=1)
hmi_df['sgd_10000_to_15000'] = hmi_df[col_list3].sum(axis=1)
hmi_df['sgd_15000_above'] = hmi_df[col_list4].sum(axis=1)
#hmi_df
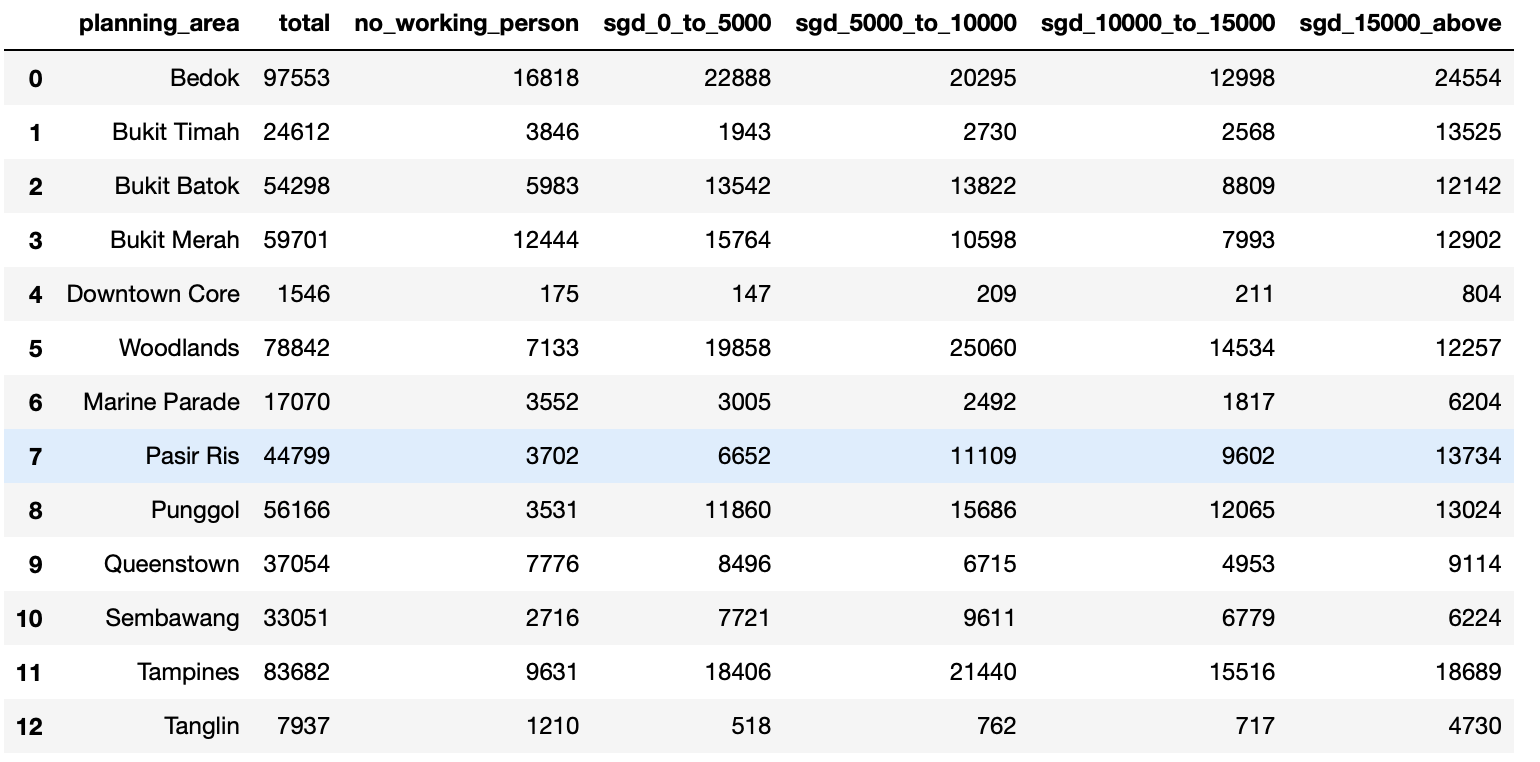
8. Save the hmi_df to csv file
# keep useful columns for visualising data
hmi_df = hmi_df[['planning_area', 'total', 'no_working_person', 'sgd_0_to_5000', 'sgd_5000_to_10000', 'sgd_10000_to_15000', 'sgd_15000_above']]
hmi_df
# export hmi_df into csv
hmi_df.to_csv('household_monthly_income_2020_cleansed.csv', index=False)
We have now prepared the dataset for useful visualisations later.
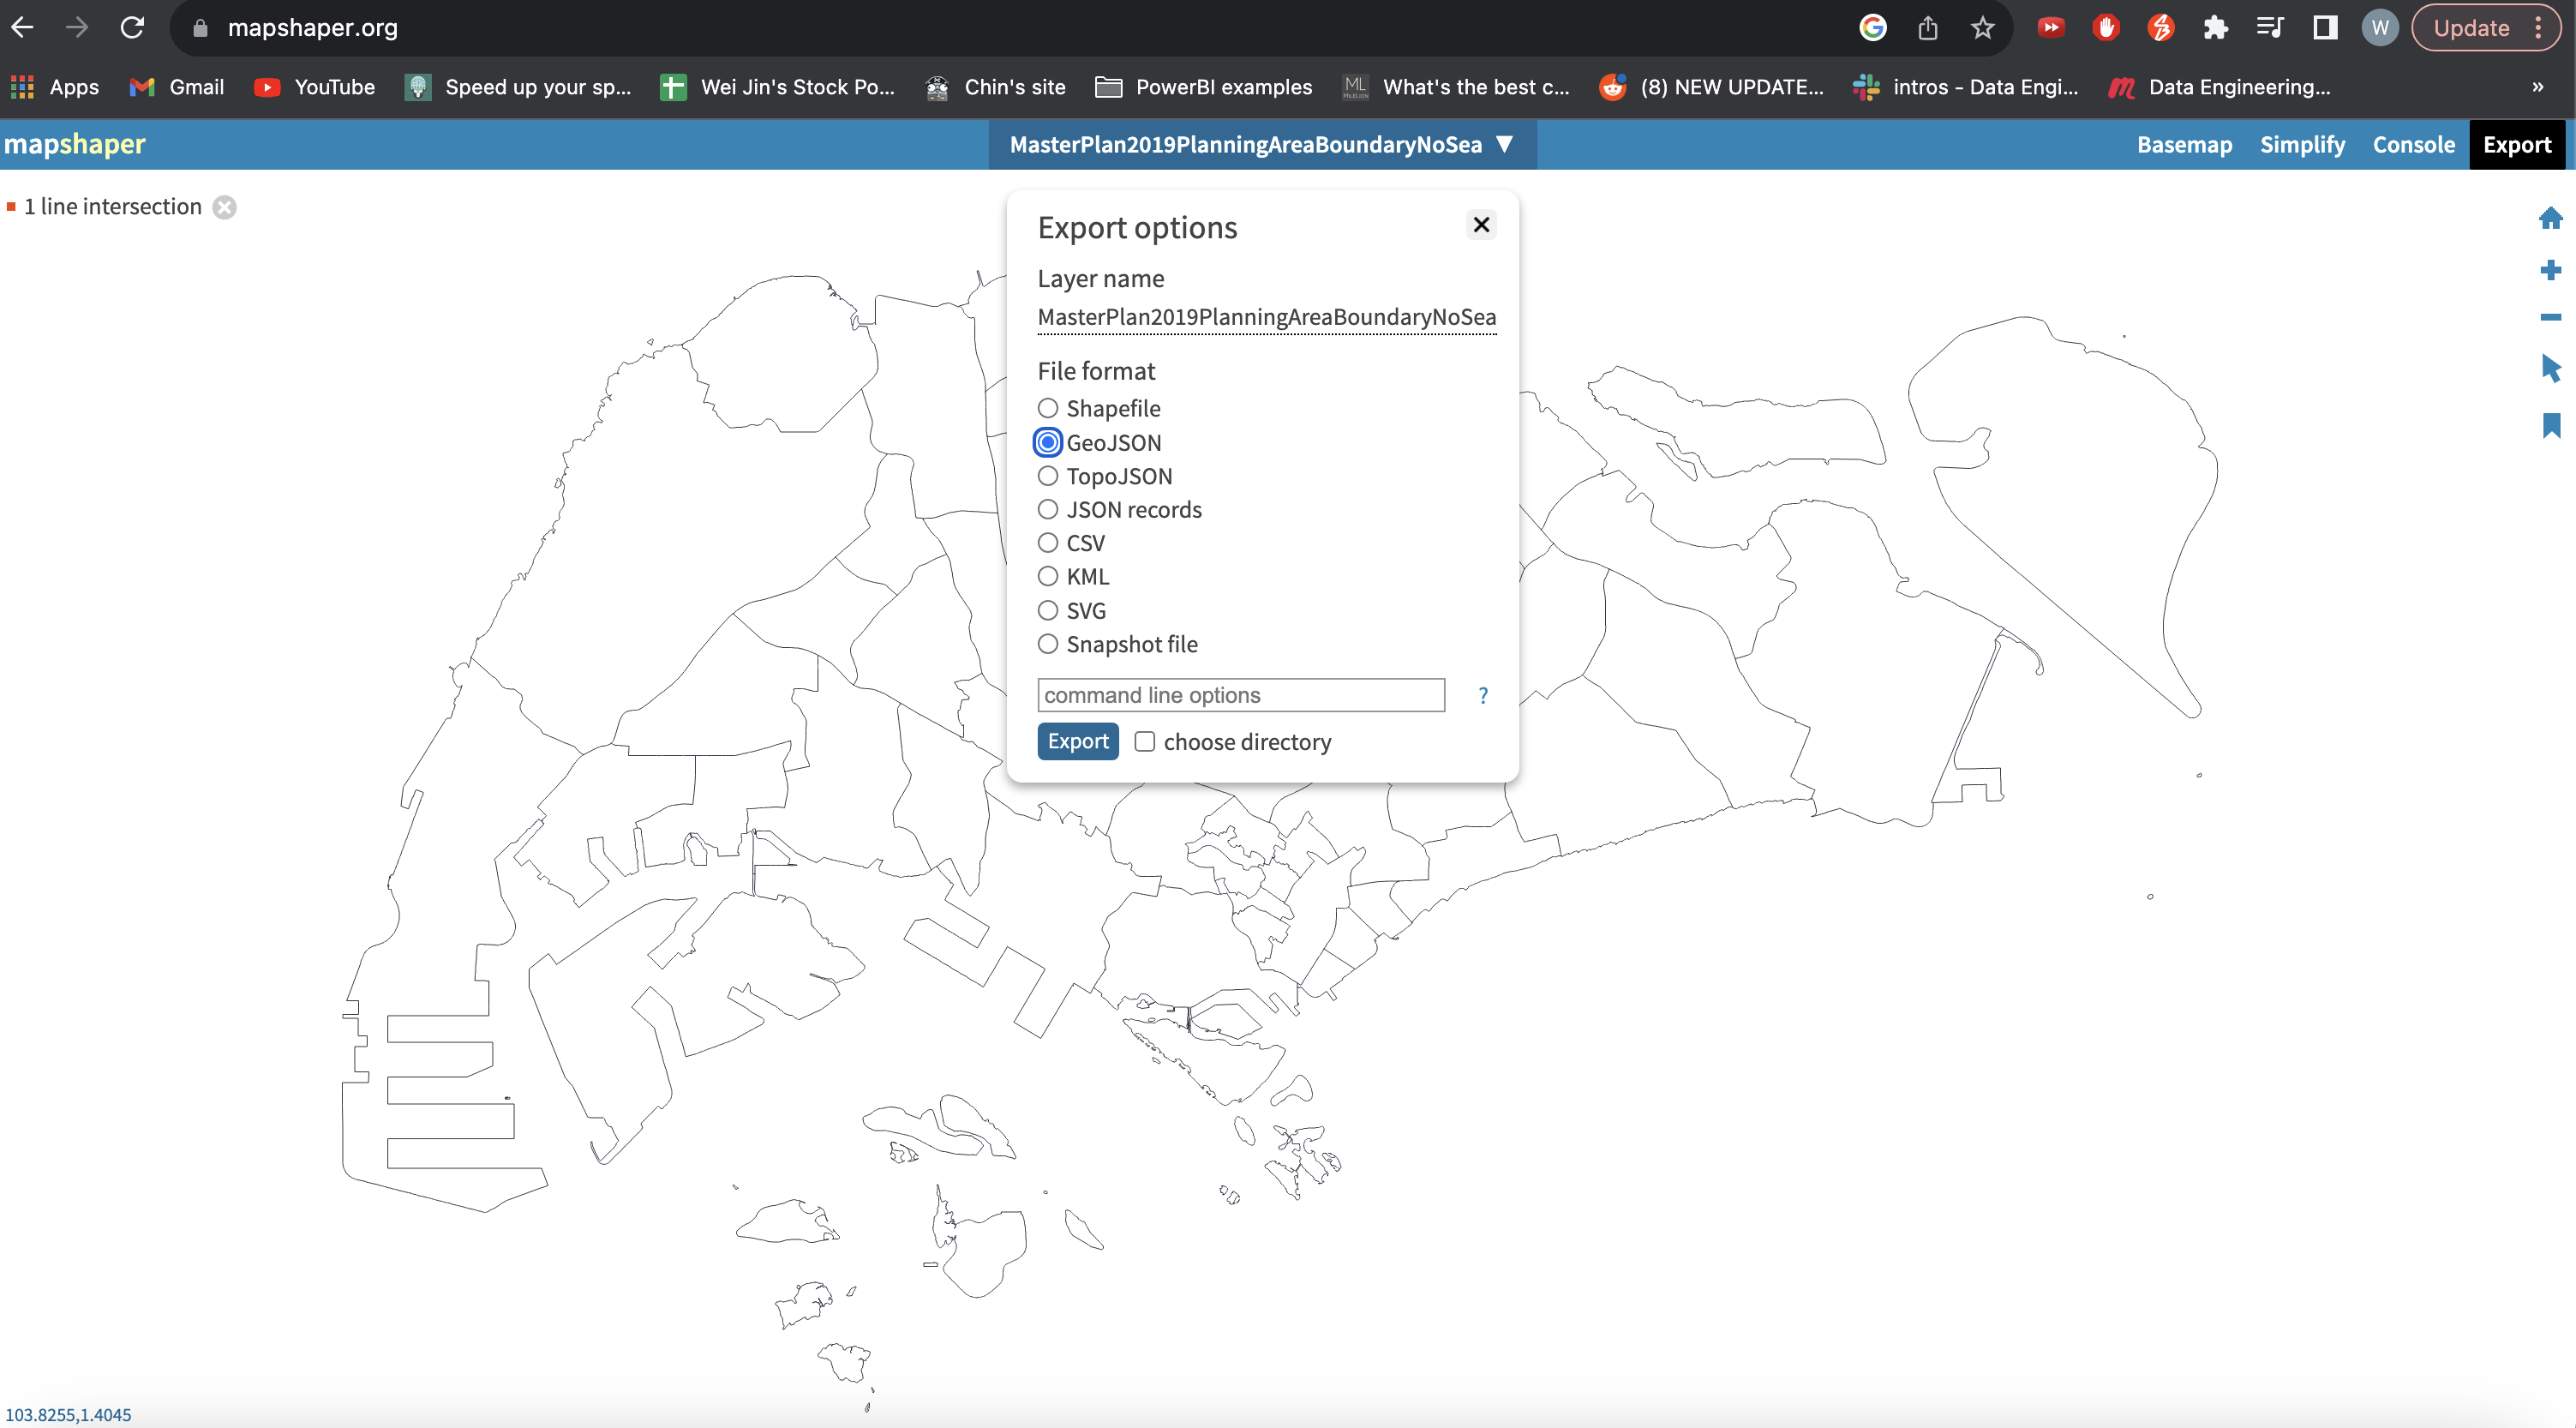
9. Download KML file from datagovsg and convert to GEOJSON file
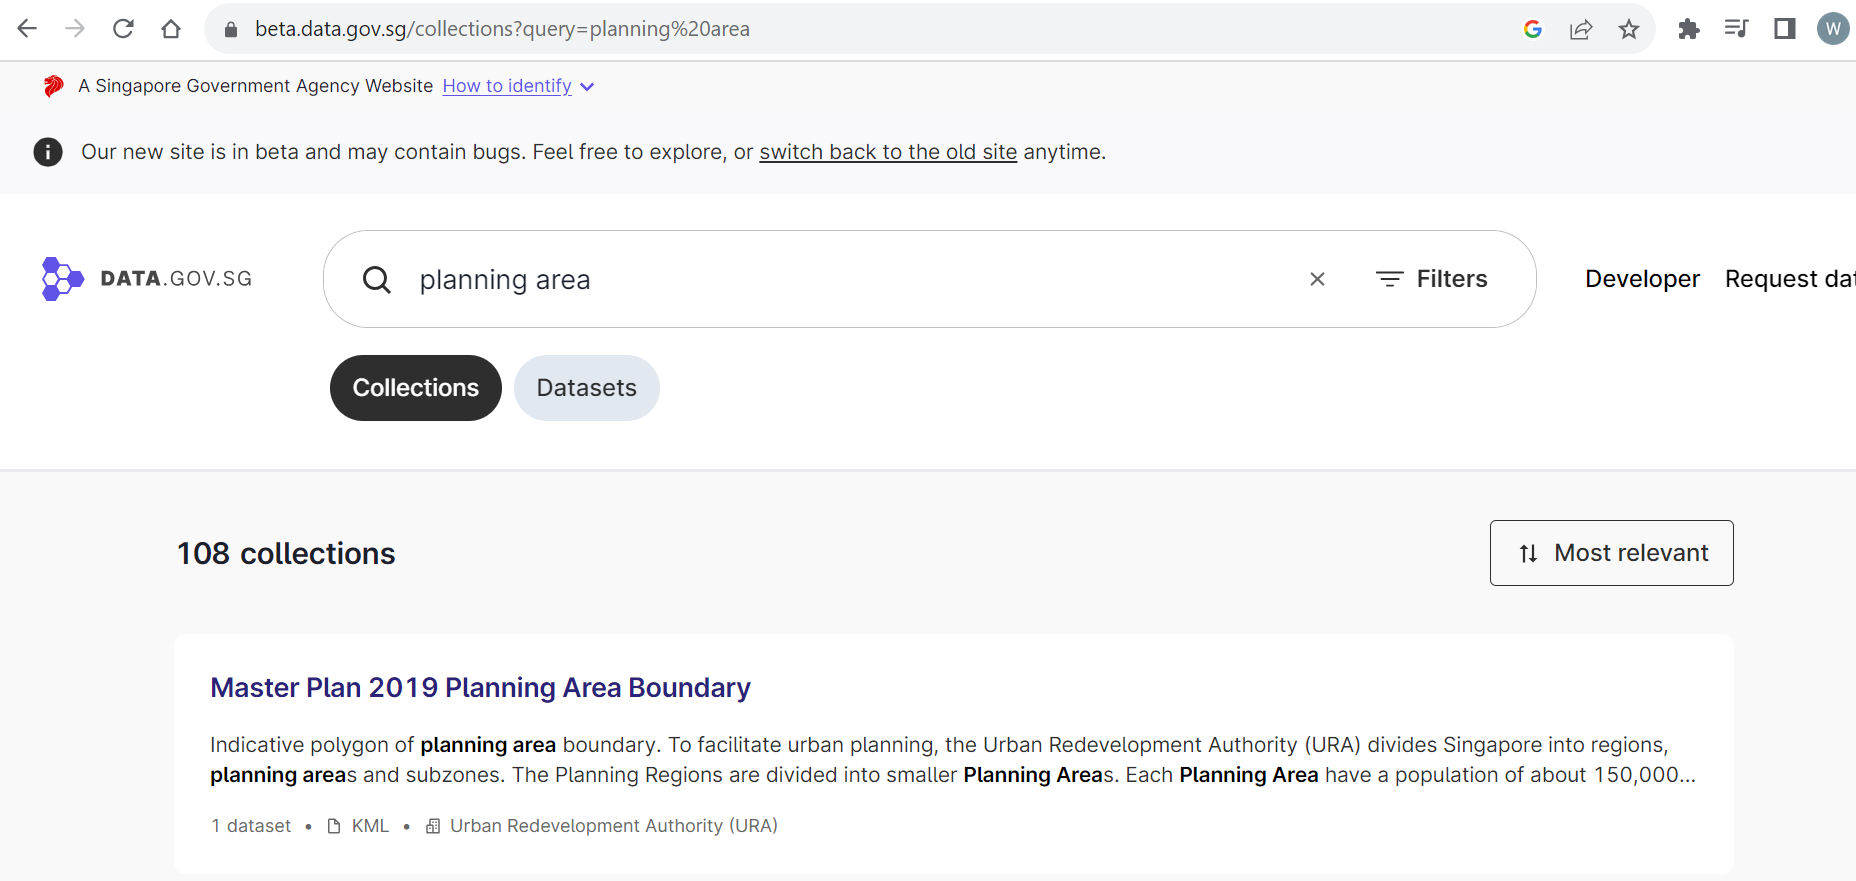
Convert KML file to JSON file using this mapshapper link. Choose the geojson option to download the Singapore Planning Areas in JSON file.
10. Create Shape Map visualizations in Power BI Desktop
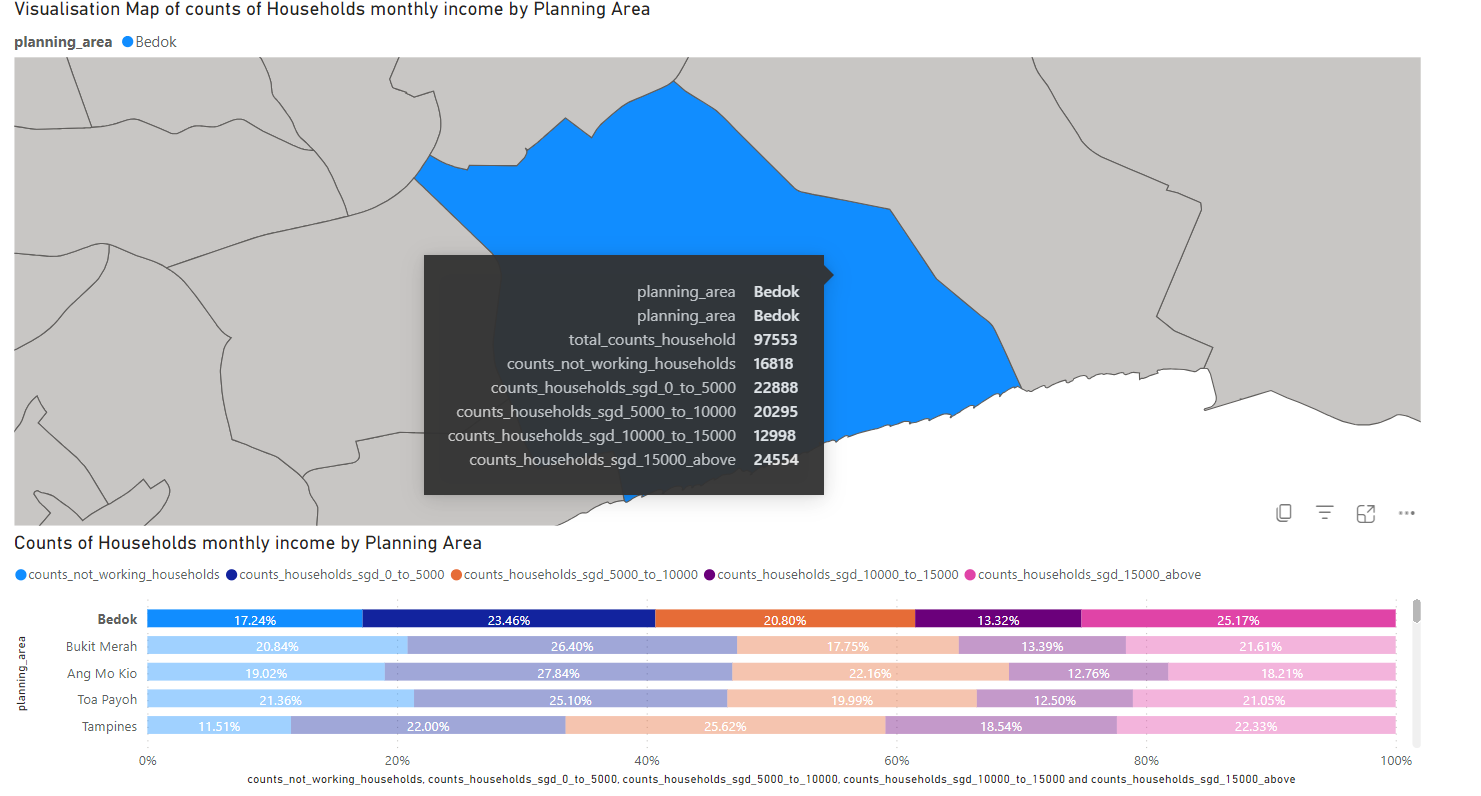
We will be using the downloaded json file to create a Shape Map in PowerBI to represent the boundaries of Planning Areas in Singapore. You may check out this Shape maps guide if this is your first time doing so.
With the above hmi_df dataset, visualise the % breakdown of different ranges of Household Monthly Income by Planning Areas. For eg. you could see that Bukit Merah has a higher percentage of households not working compared to Bedok, which may attribute to higher elderly poplation in Bukit Merah or other possbile reasons. On the other hand, Tampines has much lower non-working households compared to other areas.
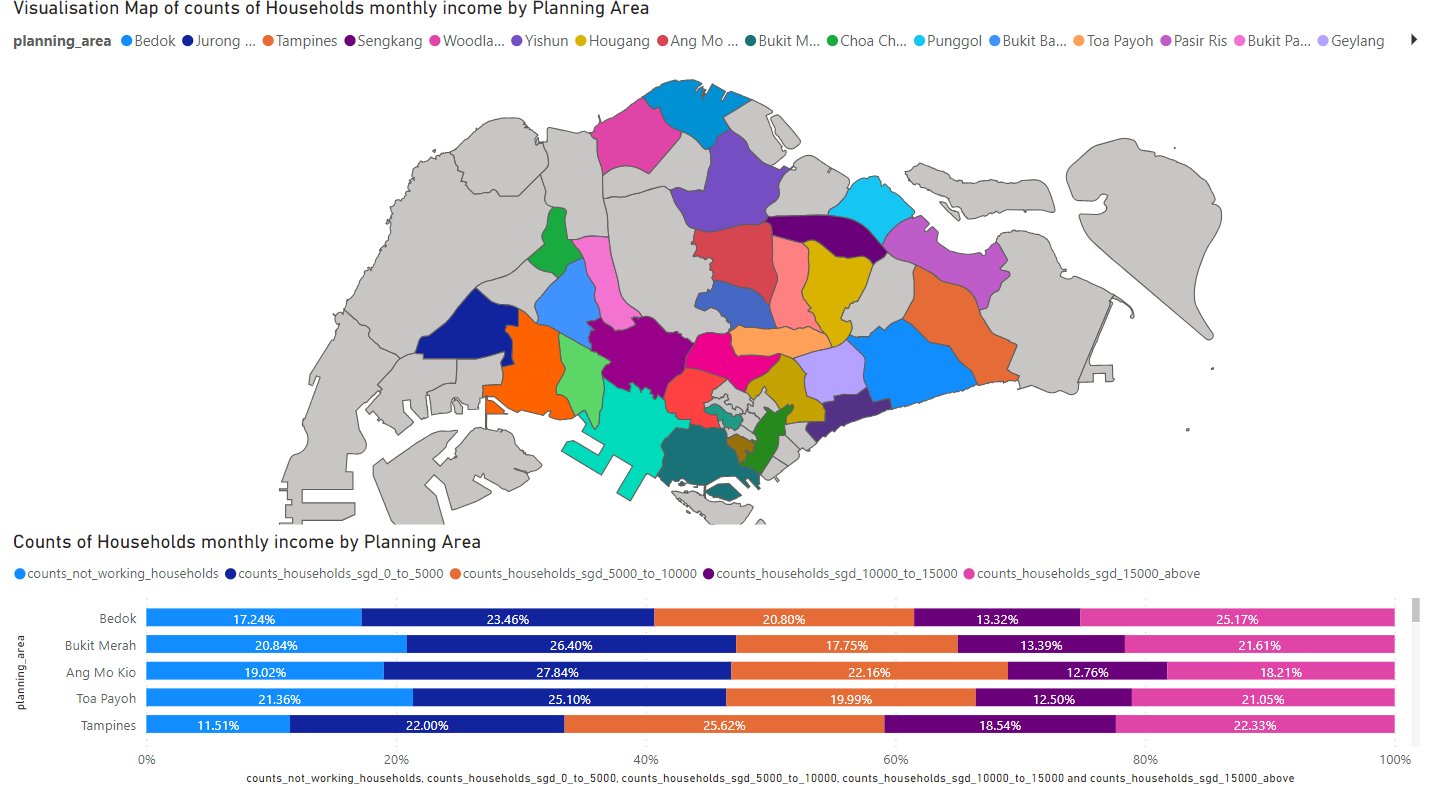
Tooltips for each planning area can be added to display the counts of households under the income bracket.
This is an exploratory data analysis project! If you find it useful, you could drill down further with other datasets to gather more insights :)