

Unlocking data insights based on the rental figures of private non-landed residential properties in Singapore! This is in continuation of the URA API series
Below contains 2 data wrangling script to unlock insights of the transactions data
- 1. Import the required libraries
- 2. Invoke the necessary parameters to work with the transaction file
- 3. Read the csv file
- 4. Join the district with district_location.csv to get location info
- 5. Filter for data in non-landed private properties
- 6. Get the transactions figures in percentile figures
- 6. Pivot the df to obtain data in a readable format
- 7. Save the final_df into a csv for useful commentary insights
1. Import the required libraries
import json
import requests
import csv
import pandas as pd
2. Invoke the necessary parameters to work with the transaction file
# Enter the refperiod of your transaction file
refperiod = "23q3"

# Extract the year and quarter using regular expressions
match = re.match(r'(\d{2})q(\d)', refperiod)

if match:
    year = match.group(1)
    quarter = int(match.group(2))

    # Calculate the start month
    start_month = str((quarter - 1) * 3 + 1).zfill(2)

    # Calculate the end month
    end_month = str(quarter * 3).zfill(2)

    # Combine the year and month to get the desired format
    startMonthID = start_month + year
    endMonthID = end_month + year

    print("Start Month:", startMonthID)
    print("End Month:", endMonthID)
else:
    print("Invalid refperiod format.")
Example output: Start Month: 0723 End Month: 0923
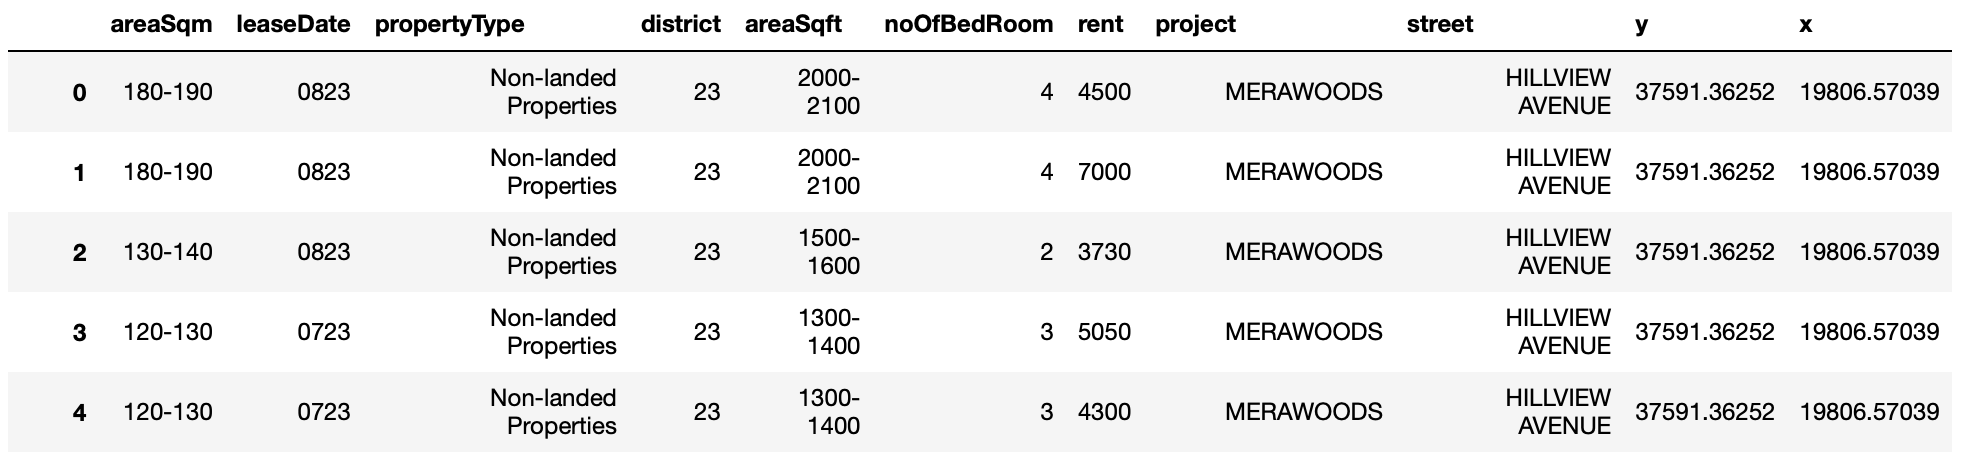
3. Read the csv file
df = pd.read_csv(f'transaction_resi_converted_raw_csv_{refperiod}.csv', converters = {'leaseDate': str, 'noOfBedRoom': str})
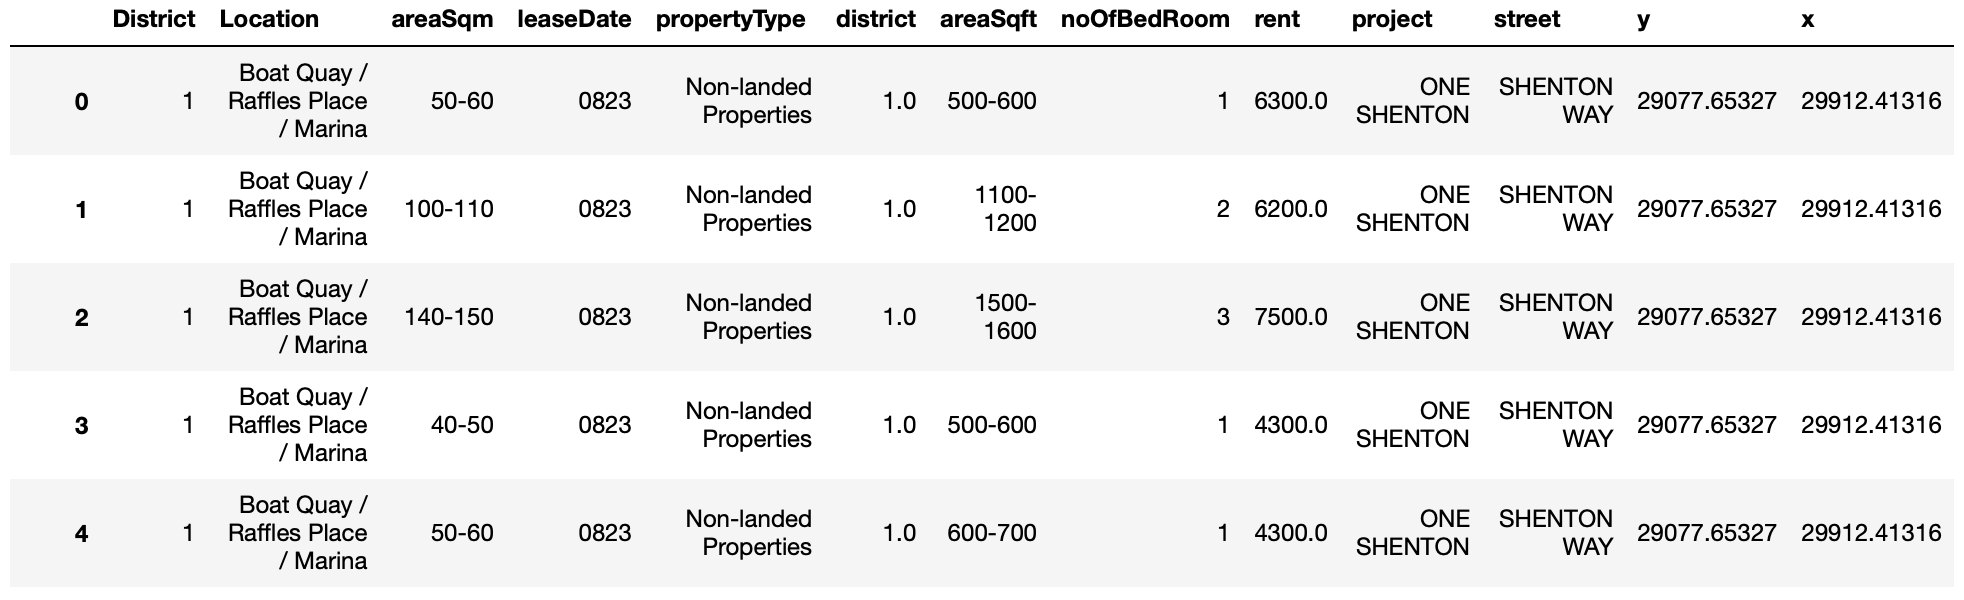
4. Join the district with district_location.csv to get location info
district_location_df = pd.read_csv('District_location.csv')
new_df = pd.merge(district_location_df, df,  how='left', left_on=['District'], right_on = ['district'])
new_df['District'] = new_df['District'].astype(int)
new_df
5. Filter for data in non-landed private properties
new_df = new_df[new_df.propertyType.isin(["Non-landed Properties", "Executive Condominium"])]
new_df = new_df[new_df.noOfBedRoom.isin(["1","2","3","4","5"])]
new_df
6. Get the transactions figures in percentile figures
df_25th = new_df.groupby(['district', 'Location', 'noOfBedRoom']).quantile(.25).rename(columns={"rent": "25th_rental"})
df_50th = new_df.groupby(['district', 'Location', 'noOfBedRoom']).quantile(.50).rename(columns={"rent": "50th_rental"})
df_75th = new_df.groupby(['district', 'Location', 'noOfBedRoom']).quantile(.75).rename(columns={"rent": "75th_rental"})
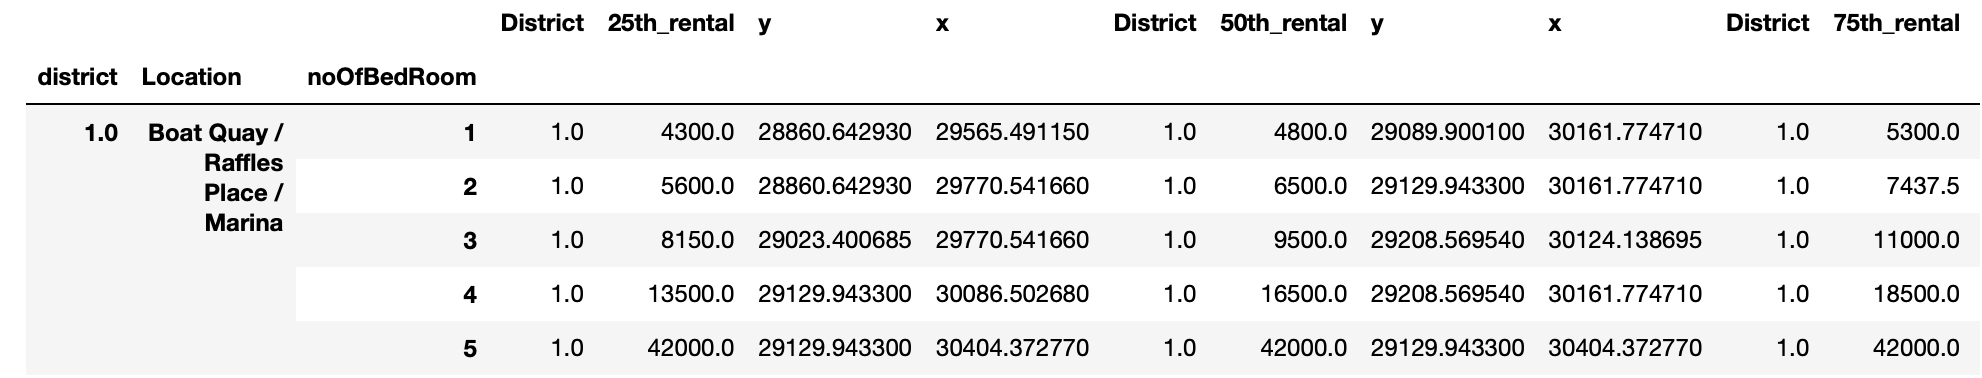
6. Pivot the df to obtain data in a readable format
final_df = pd.concat([df_25th] + [df_50th] + [df_75th], axis=1)
final_df = pd.pivot_table(final_df, values = ['25th_rental','50th_rental','75th_rental'], index=['Location' , 'district'], columns = 'noOfBedRoom').sort_values(by='district', ascending = True).reset_index()
final_df['district'] = final_df['district'].astype(int)
final_df.columns = final_df.columns.swaplevel(0, 1)
final_df.sort_index(axis=1, level=0, inplace=True)
final_df
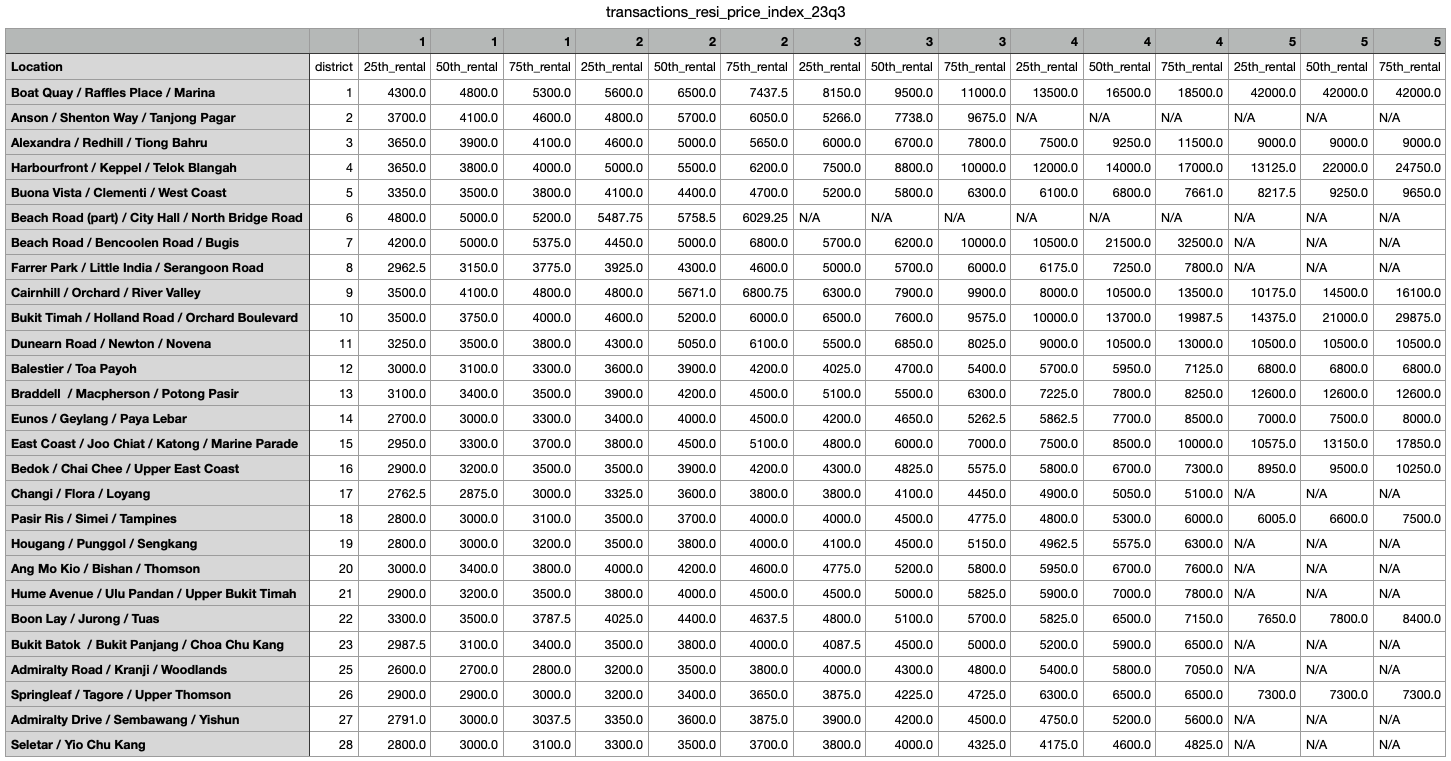
7. Save the final_df into a csv for useful commentary insights
final_df.to_csv(f'transactions_resi_price_index_{refperiod}.csv', na_rep='N/A', quoting=csv.QUOTE_NONE, index=False)
The output file is useful for drawing commentary insights for Singapore Residental rental market on a quarterly basis. You may also combine datasets for further analytical purposes such as time-series trend lines.