

URA release a masterplan every few years and boundaries might change. With property transactions data coming in everyday, how do you identify an address is categorised under the right Planning Area & Region quickly and accurately?
The objective of this post is to explain how to classify a property address with the right Region, Planning Area and Subzone by URA standards.
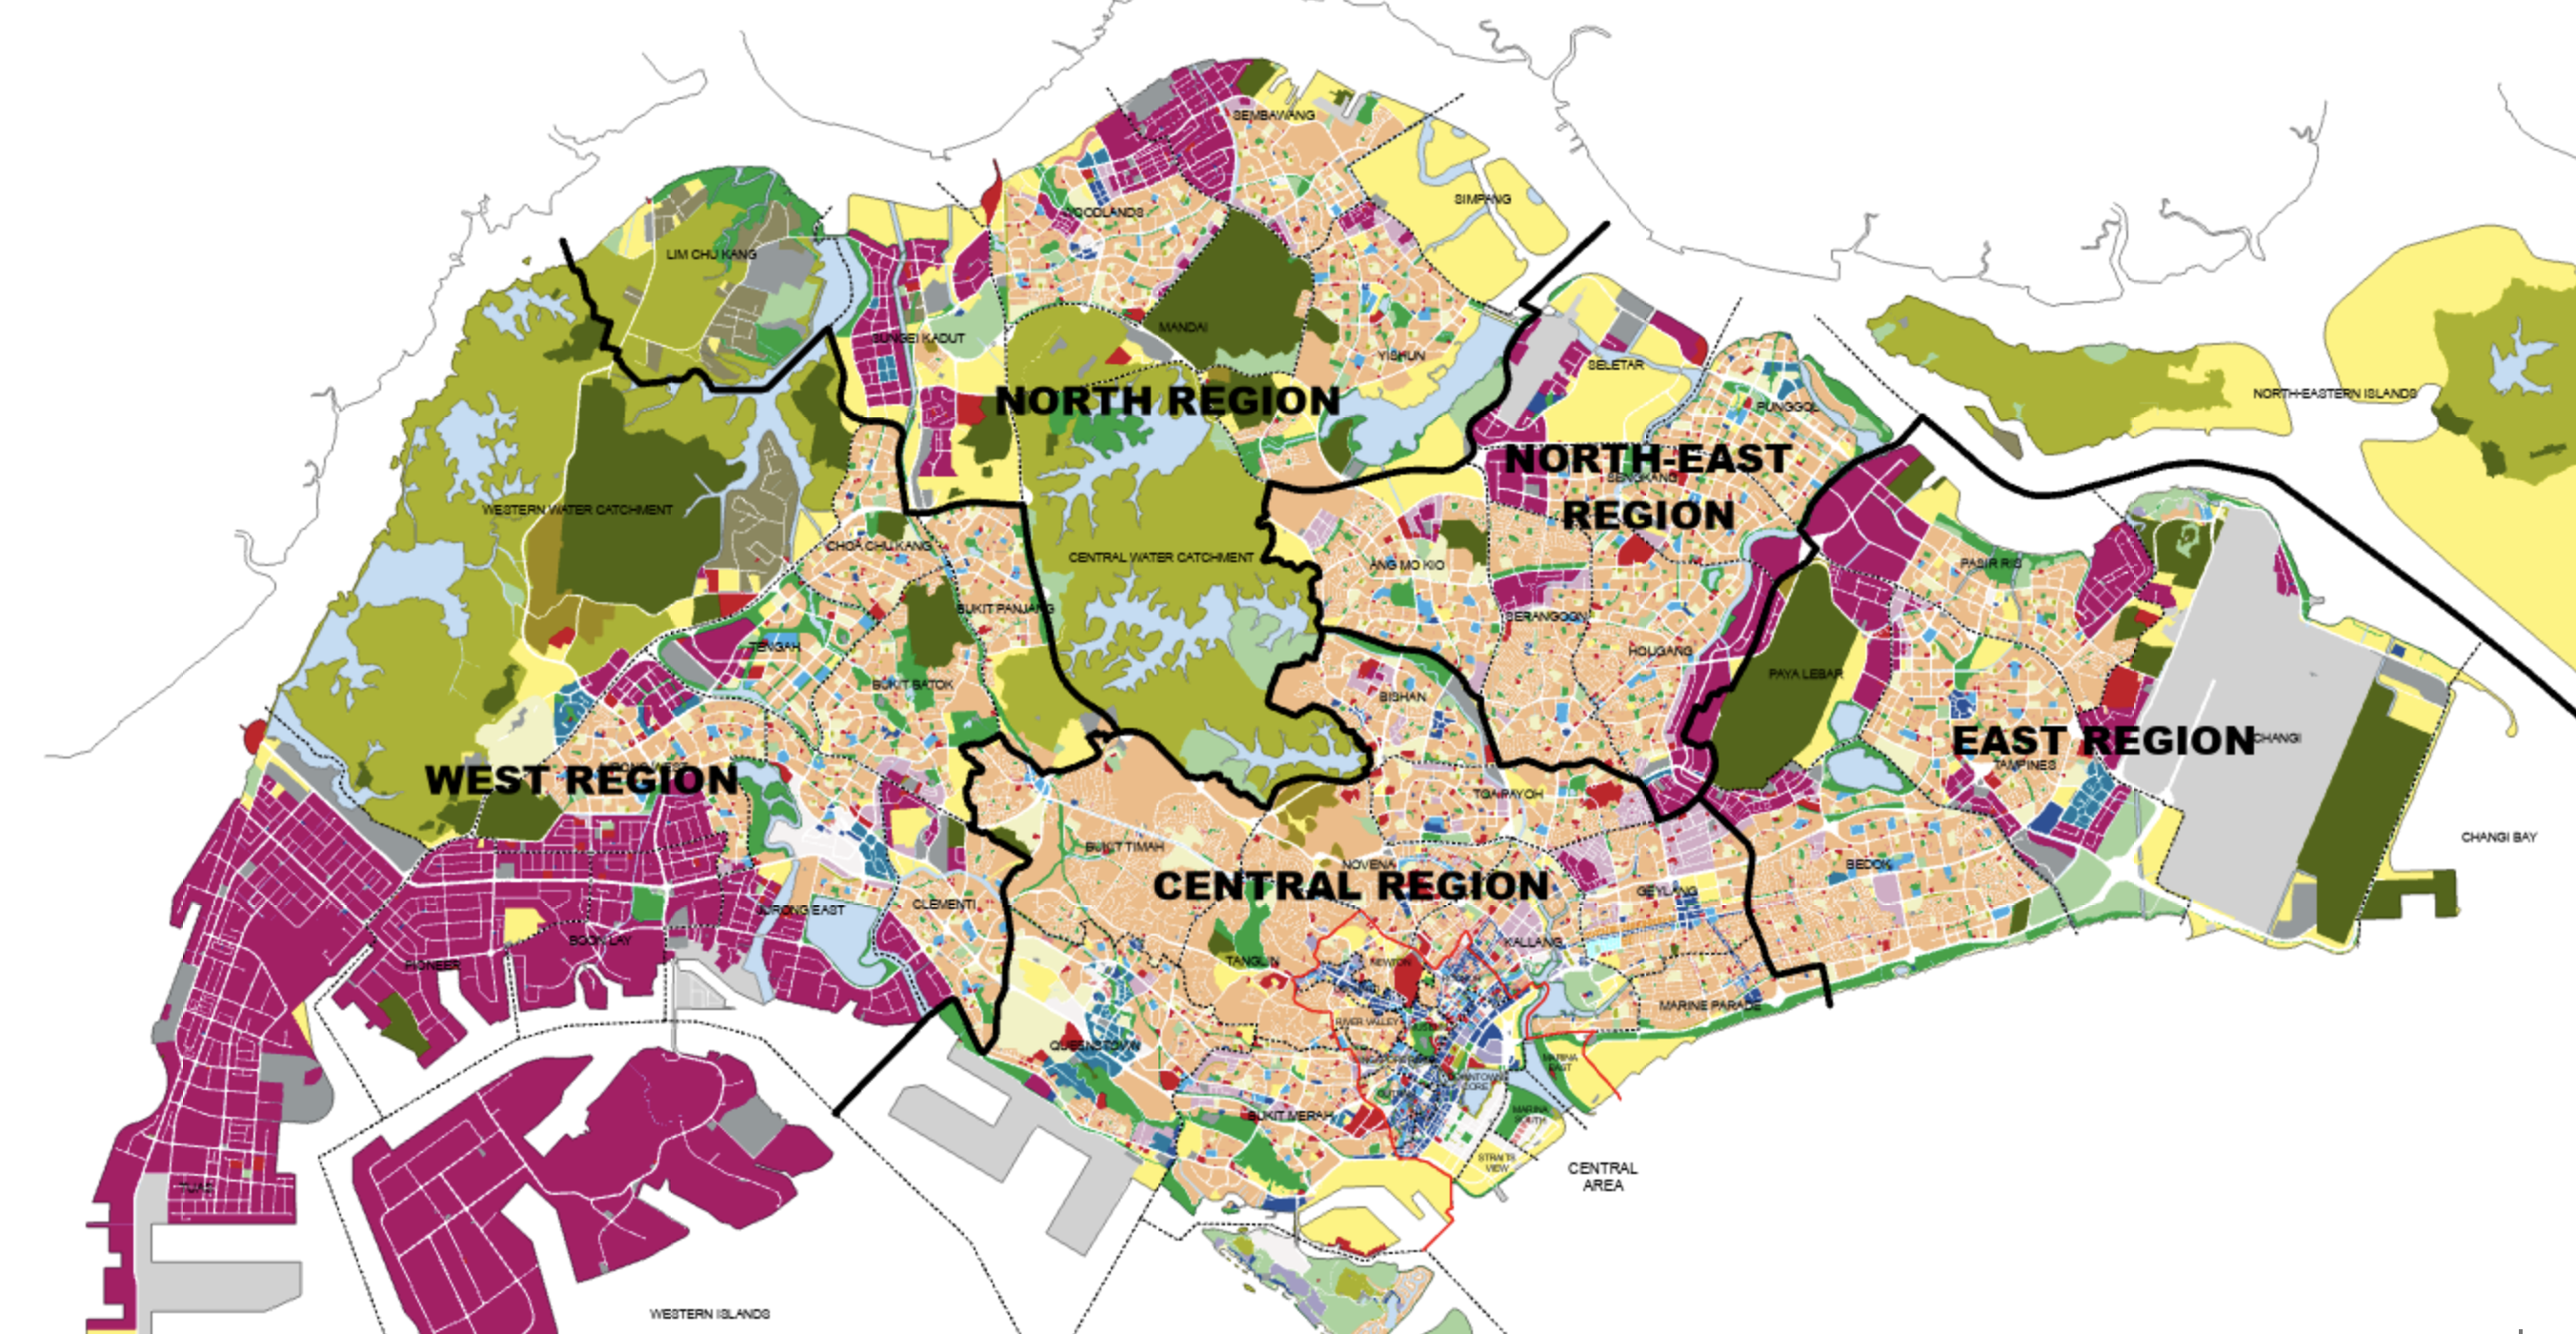
A photo of the URA masterplan separated by Region
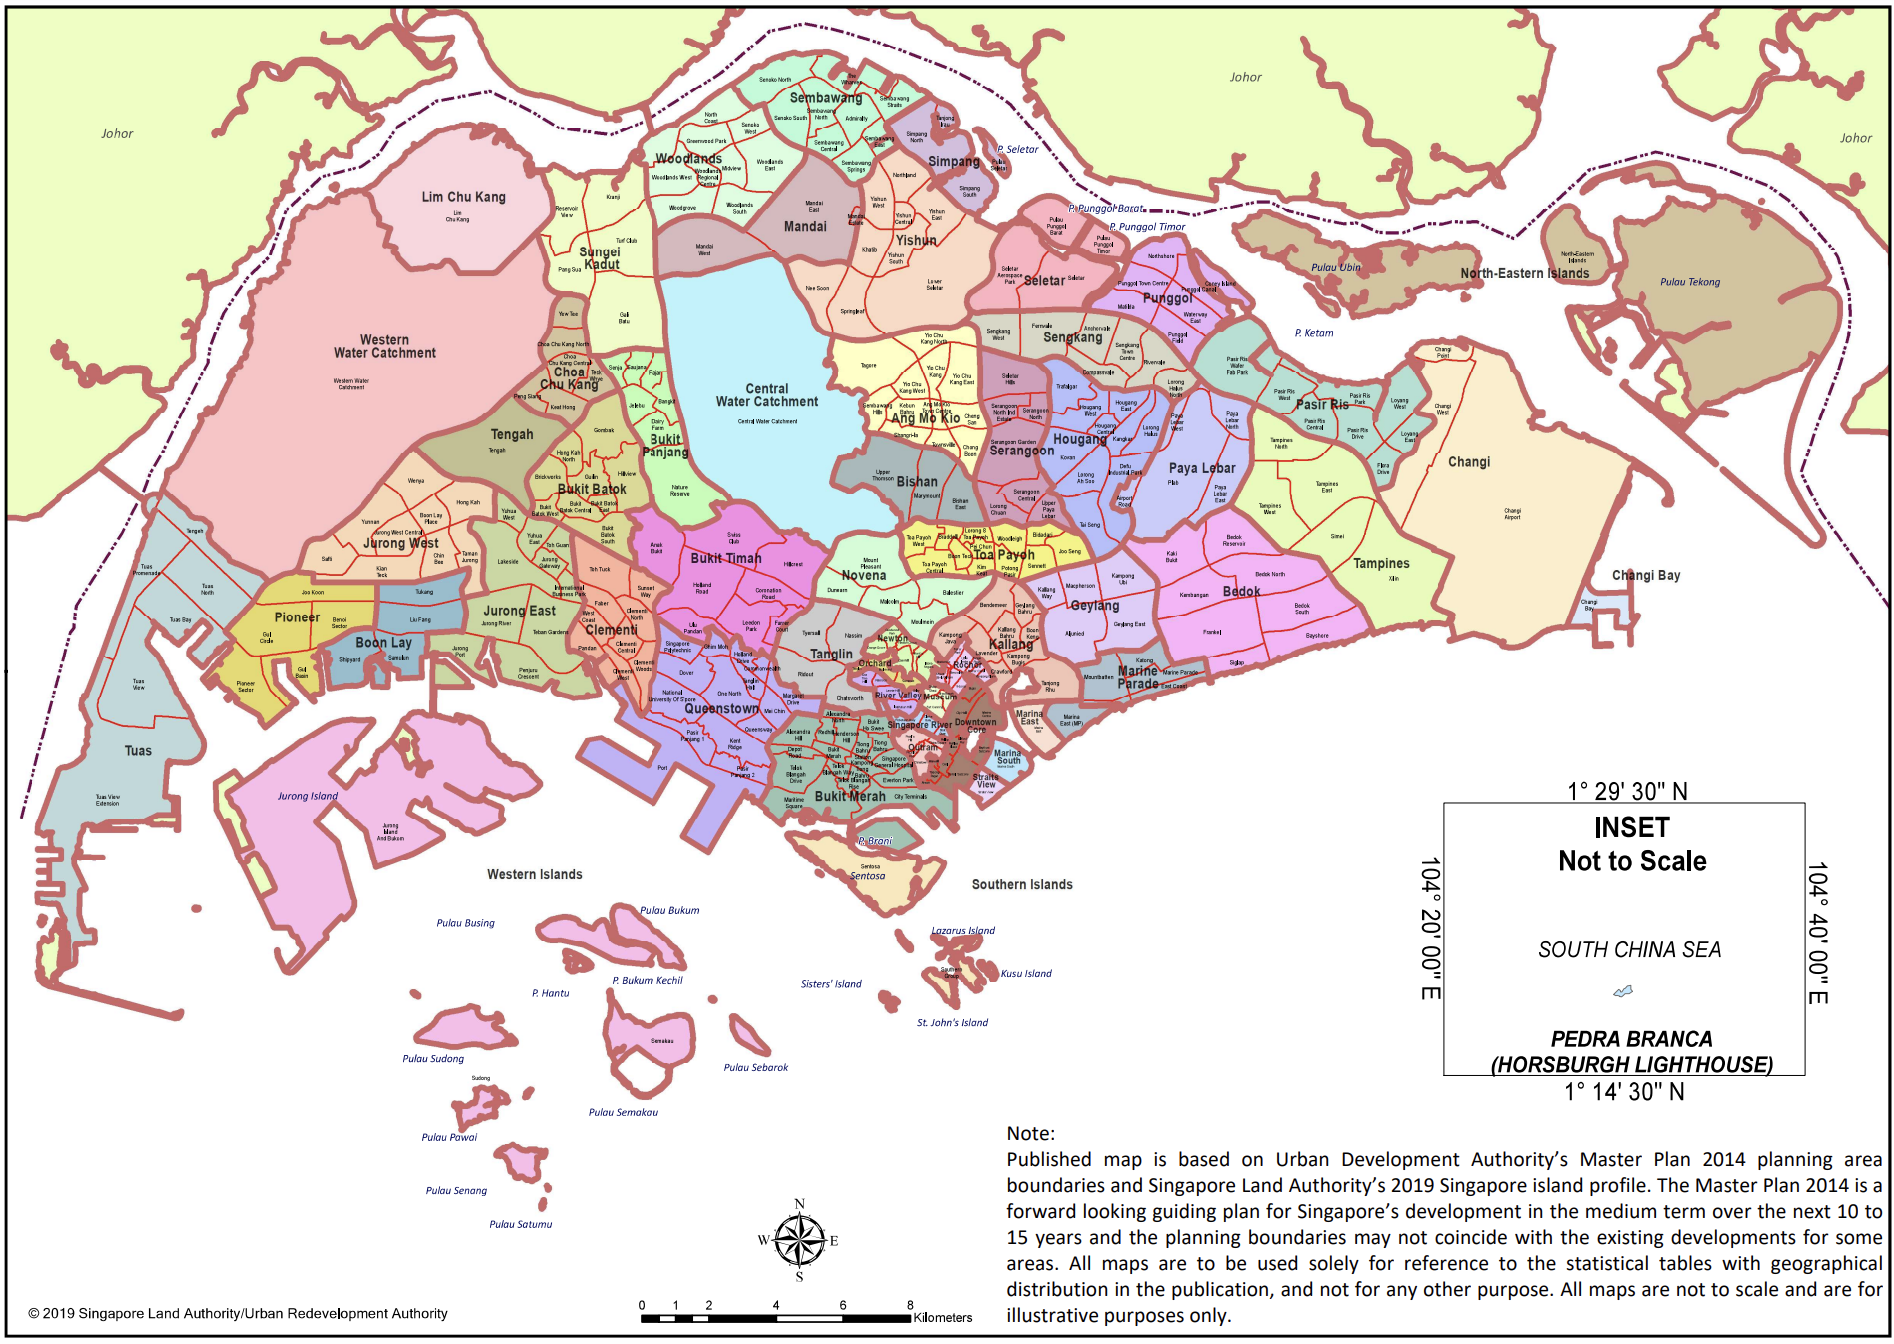
A photo of the URA masterplan separated by Planning Area
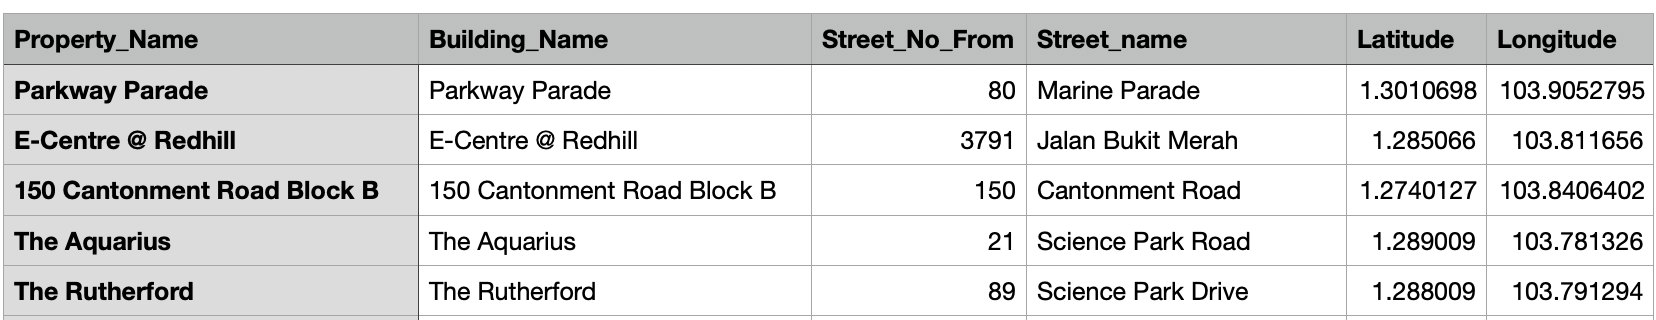
Before we start, we need some sample data with Property addresses. To achieve our objective, we also need the Latitude and Longtitude information along with the Property addresses. The data you are working with may come with latitude/longitude pair or in another geographic format like SVY21. You may make use of conversion script to convert to Latitude and Longtitude if necessary.
If the data source you are working on do not have any geocoding information, you may make use of Google Geocoding API to get the Latitude and Longtitude information.
- 1. Use Google Geocoding API to get the Lat & Long (skip this step if it is not relevant for you)
- 2. From datagovsg, URA updates the masterplan every few years and we will be able to get the most recent updated KML file of the Singapore planning area.
- 3. Using the above URA GeoJSON file, get the Region, Planning Area & Subzone with GeoPandas
- 4. Plot the building pins on the polygon map
- 5. Export the final df with the required columns
1. Use Google Geocoding API to get the Lat & Long (skip this step if it is not relevant for you)
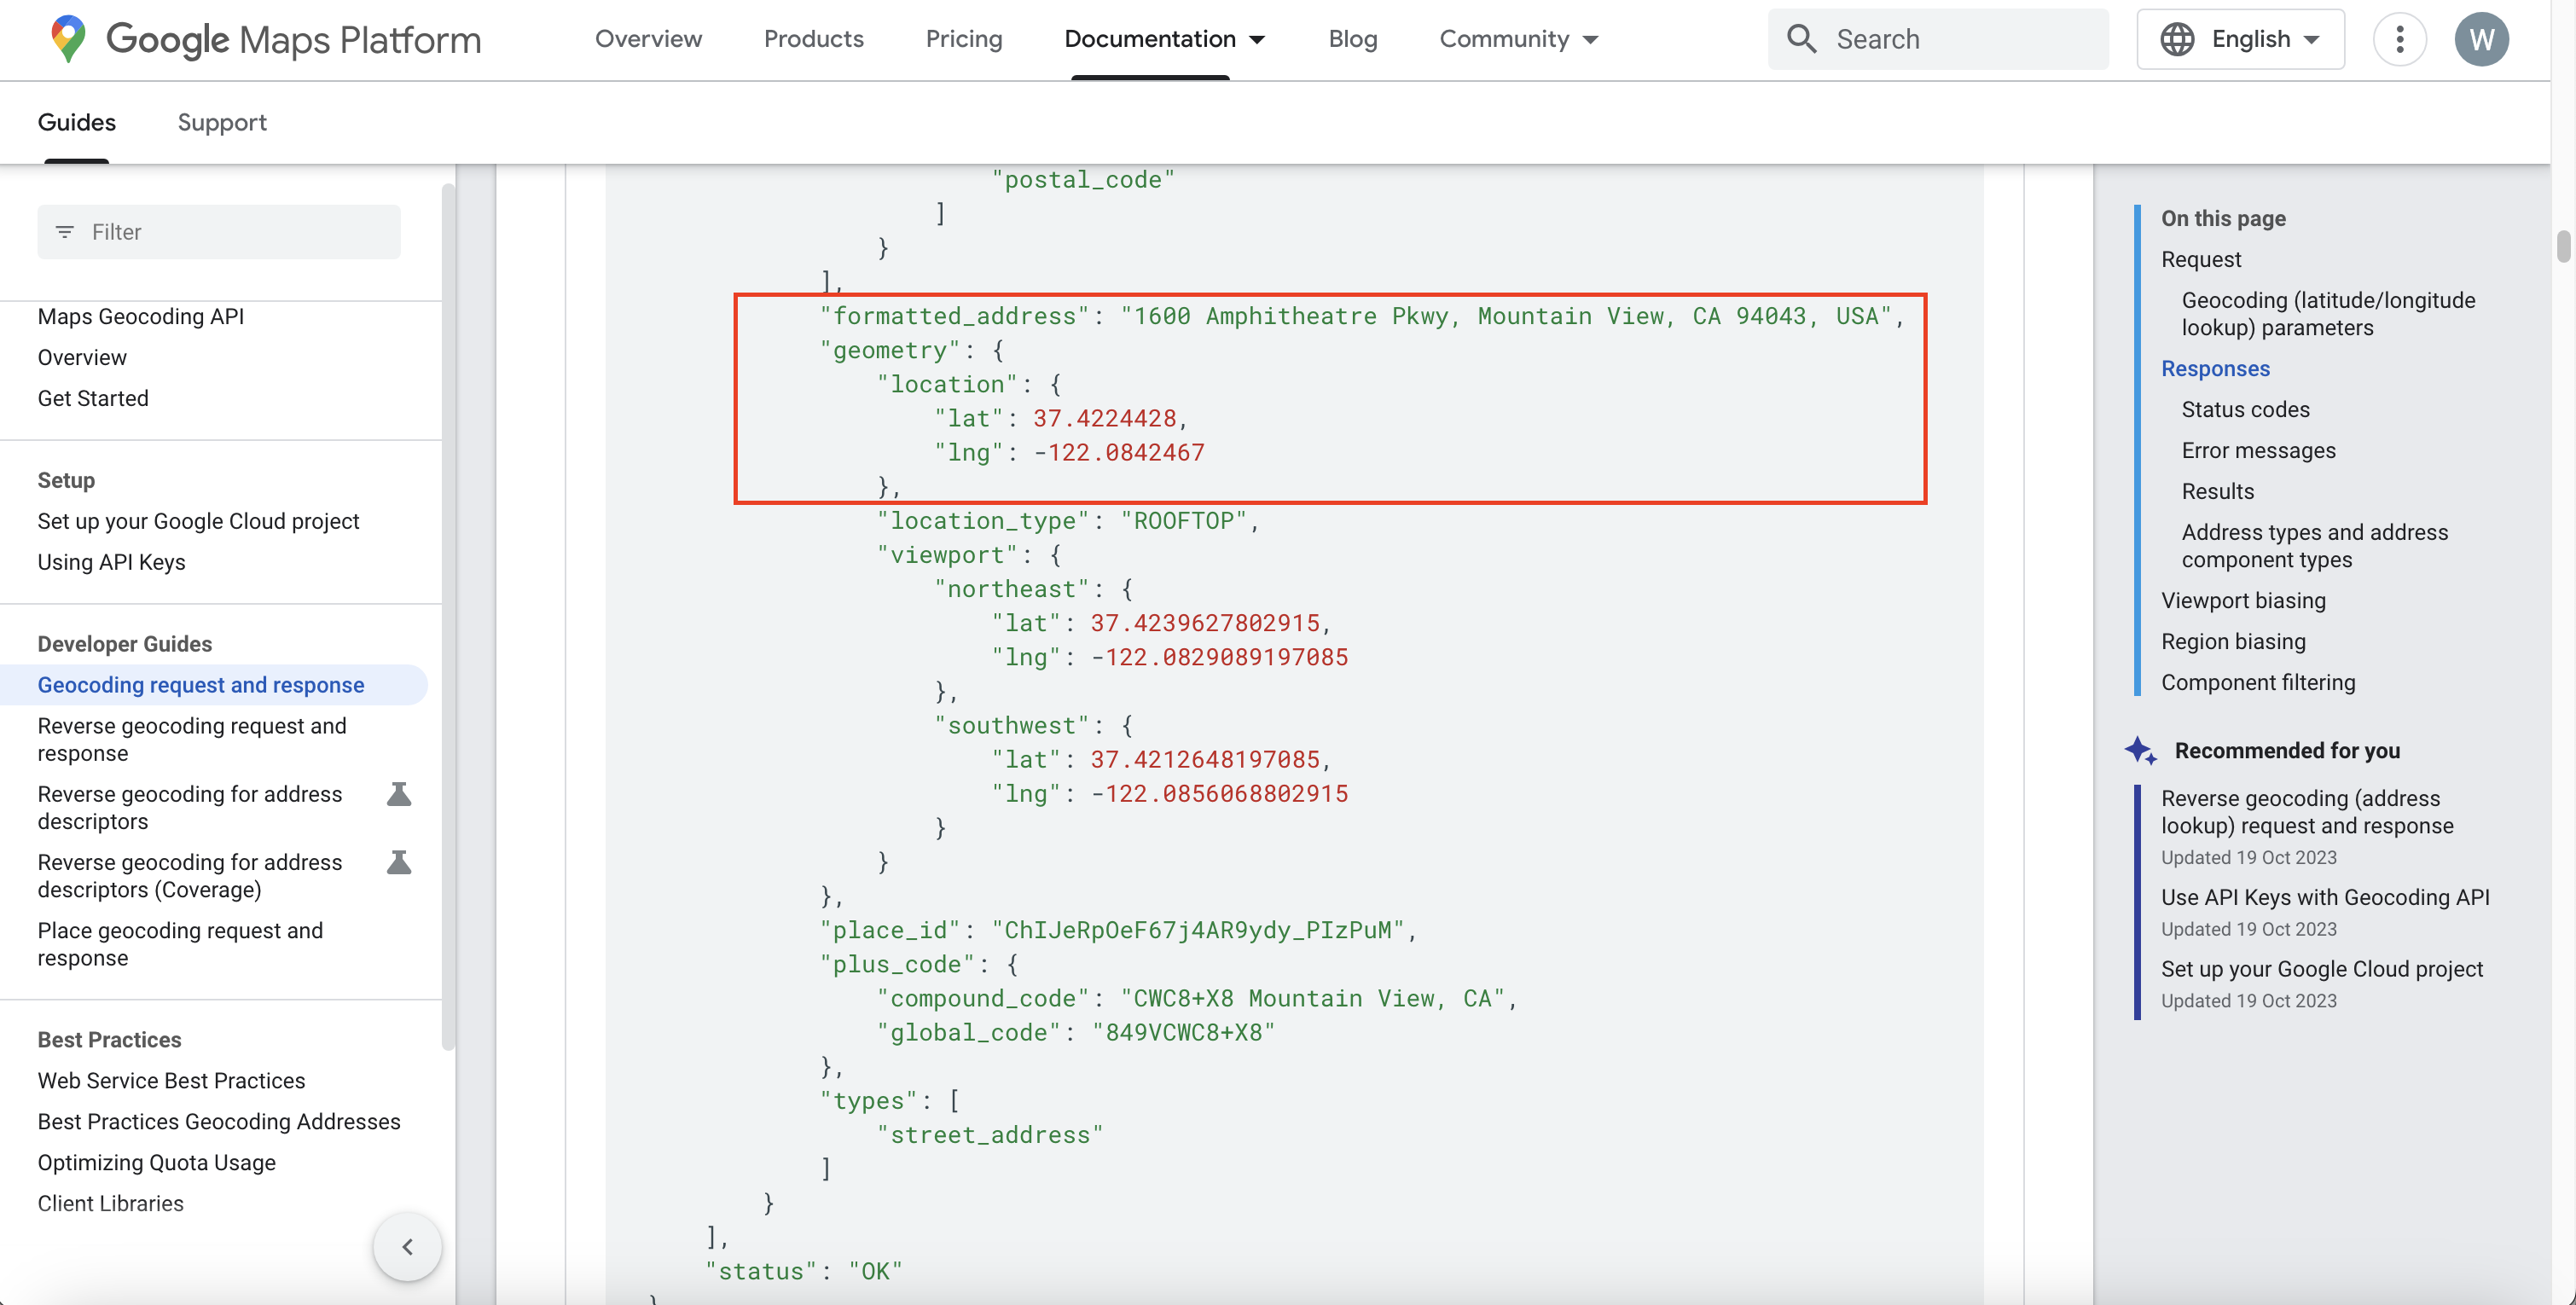
You may check out the Google Geocoding API doc to learn more. Google Geocoding API returns an output response that have many useful information. The below python code takes in a list of addresses and return relevant information that we need for our own use. The tags in the returned json file we are capturing are: formatted_address and geometry.
import googlemaps
from datetime import datetime
import pandas as pd
import json
import csv

#place your googlemaps API key between the '' in next step
gmaps = googlemaps.Client(key='PUT YOUR API KEY')
header = ('"input address","formatted address","Latitude",\"Longitude"')
newdata = []
newdatacsv = []
newdata1 = []
json_data = []

#create a text file with addresses on each line and replace "addresses.txt" with the path to the file
file =open("C:\\Users\\weijin.ang/\\Code\\property_addresses.txt", 'r', encoding = 'utf8')
for line in file:
    line1 = gmaps.geocode(line)
    #extract the relevent values
    lat = line1[0]["geometry"]["location"]["lat"]
    long = line1[0]["geometry"]["location"]["lng"]
    lat = str(lat)
    long = str(long)
    formadd = line1[0]["formatted_address"]
    formadd=str(formadd)
    csvline = '"' + line + '",'+'"' + formadd + '",' + lat +',' +long
    newdatacsv.append(csvline)
print(newdatacsv)

#write the data to csv
with open("C:\\Users\\weijin.ang/\\Code\\property_addresses_with_lat_long.csv", "w+", encoding = 'utf8') as newdatafile:
    newdatafile.write(header + "\n")
    for line2 in newdatacsv:
        newdatafile.write(line2 + "\n")
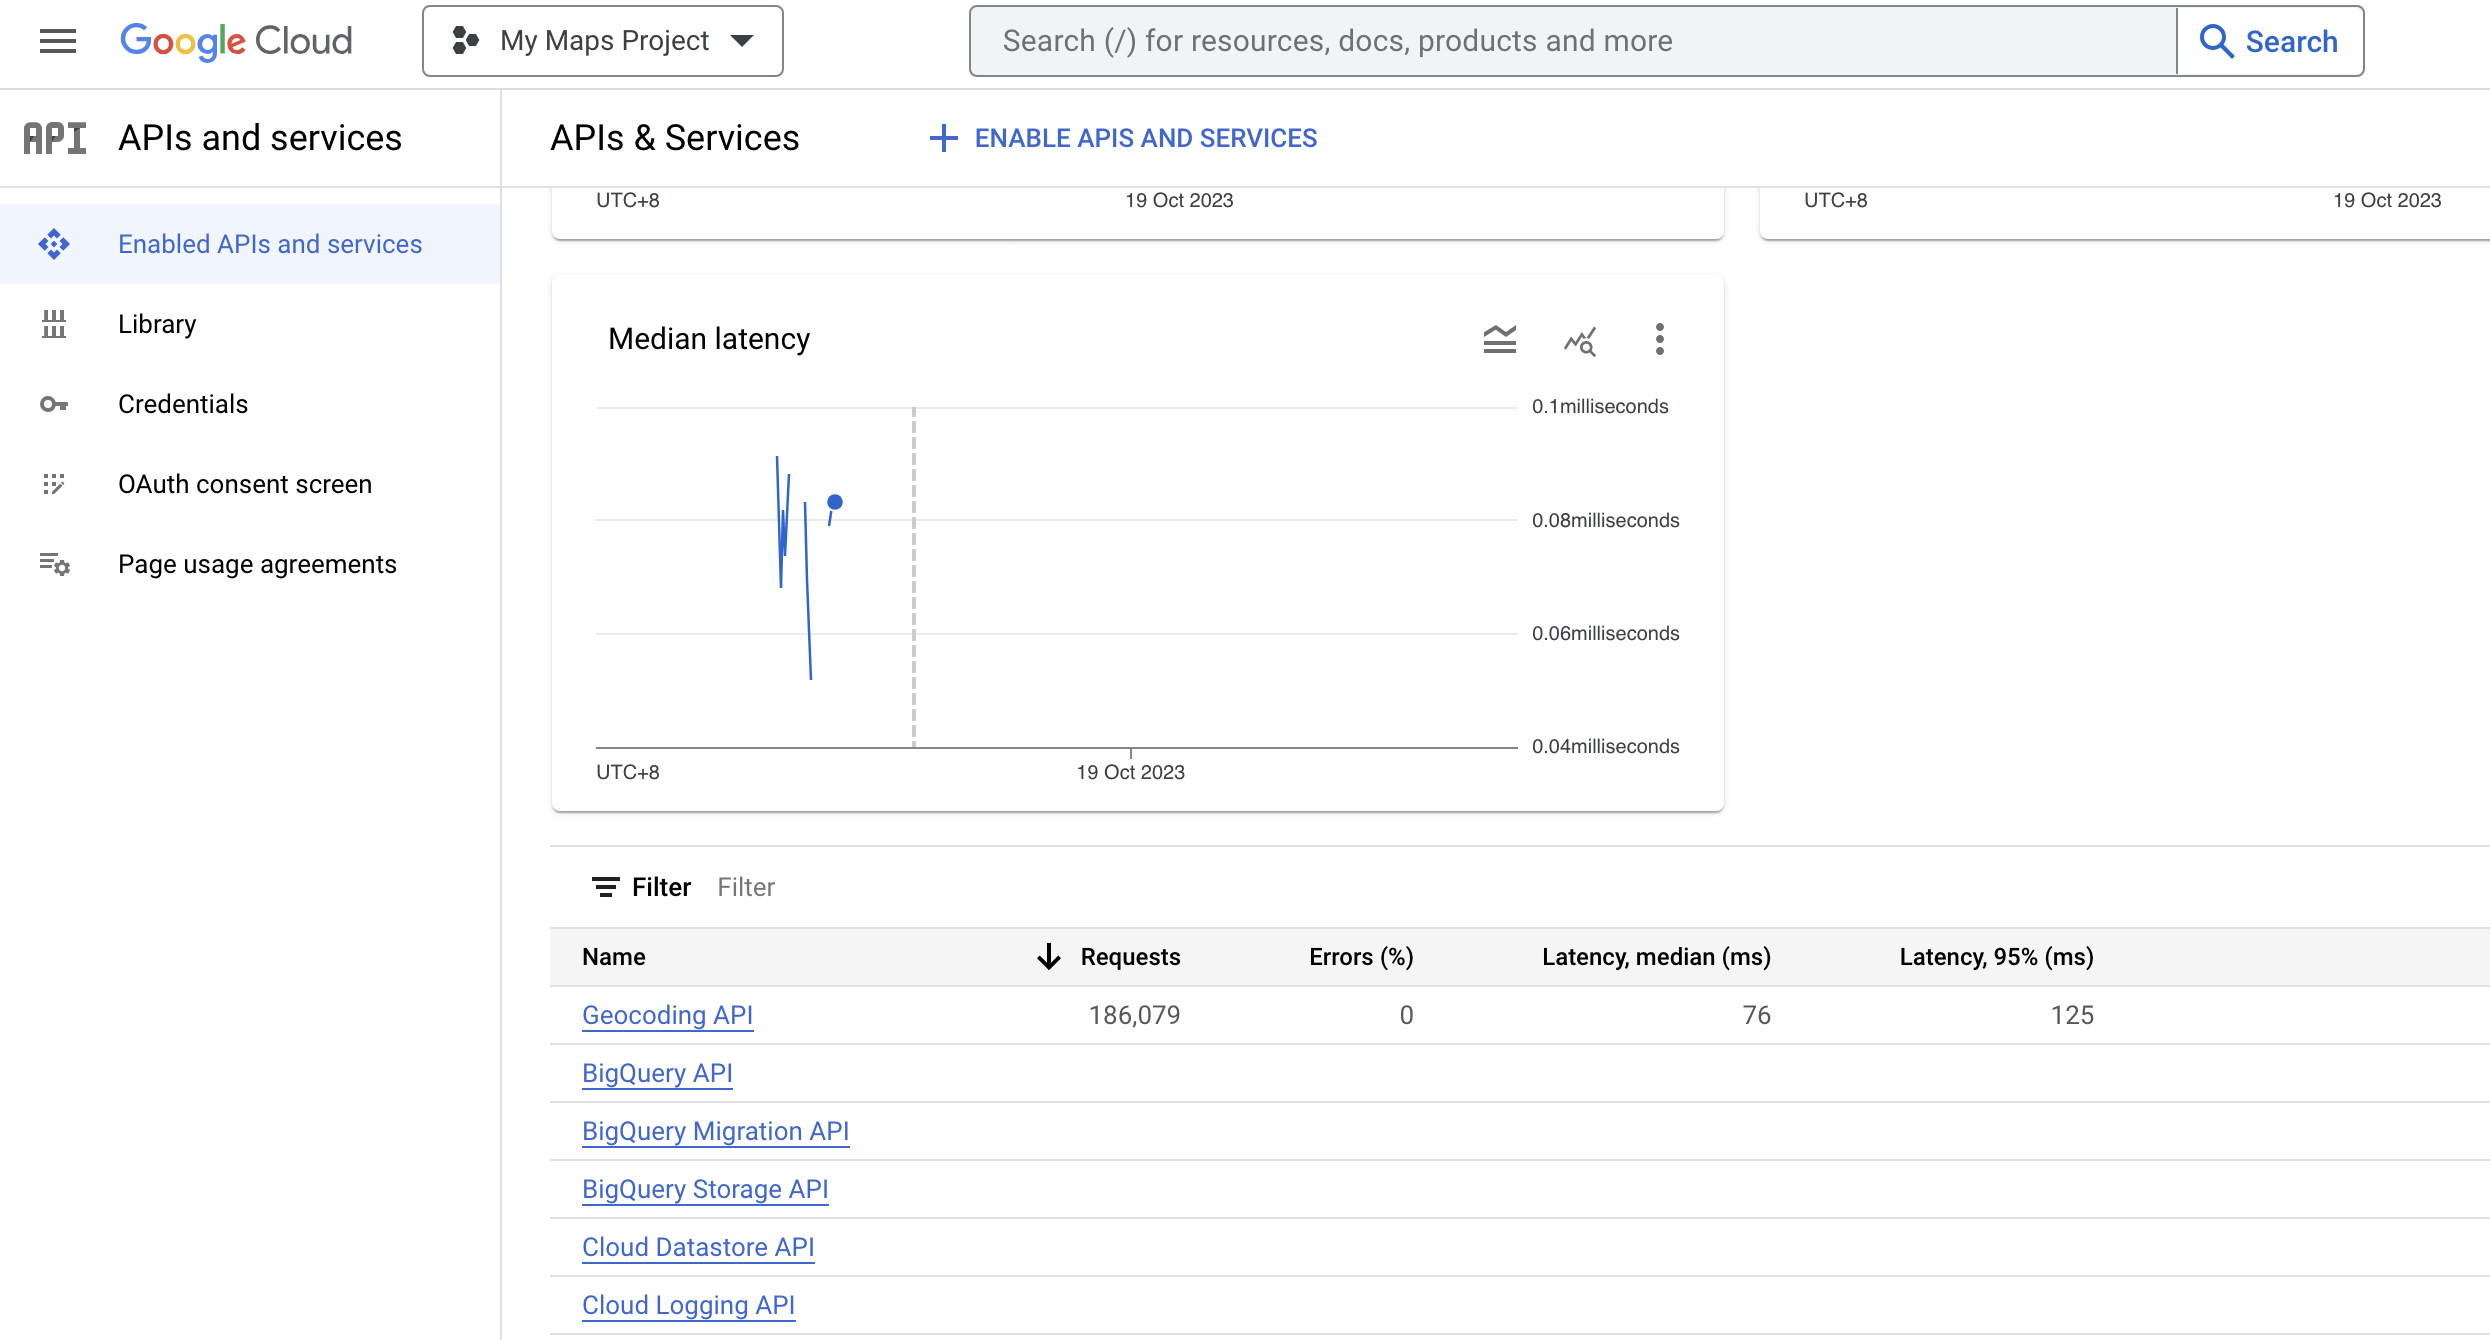
You may monitor the API traffic and error response via the Google console
Example source file:
2. From datagovsg, URA updates the masterplan every few years and we will be able to get the most recent updated KML file of the Singapore planning area.
Convert the KML file to GeoJSON file using this link
3. Using the above URA GeoJSON file, get the Region, Planning Area & Subzone with GeoPandas
import os
import geopandas as gpd
import pandas as pd
import numpy as np
import matplotlib.pyplot as plt
from shapely.geometry import Point
from datetime import datetime
from matplotlib.pyplot import figure

#Reads the map file
#Source file is from data gov sg
# this method is reading geojson file and is recommended by geopandas
master_subzone = gpd.read_file('C:/Users/weijin.ang/Code/PlanningBoundaryArea.json')
master_subzone

#Reads your list of buildings
buildings_df = pd.read_csv('C:\\Users\\weijin.ang/\\Code\\test2.csv')
buildings_df

#Plots the buildings on the map as pins/points
buildings_df['coords'] = list(zip(buildings_df['Longitude'],buildings_df['Latitude']))
buildings_df['coords'] = buildings_df['coords'].apply(Point)
points = gpd.GeoDataFrame(buildings_df, geometry='coords', crs=master_subzone.crs)
points_building = gpd.GeoDataFrame(buildings_df, geometry='coords', crs=master_subzone.crs)
points_building

#Identifies the polygon each point belongs to
pointInPolys = gpd.tools.sjoin(points_building, master_subzone, predicate="within", how='left')
pointInPolys
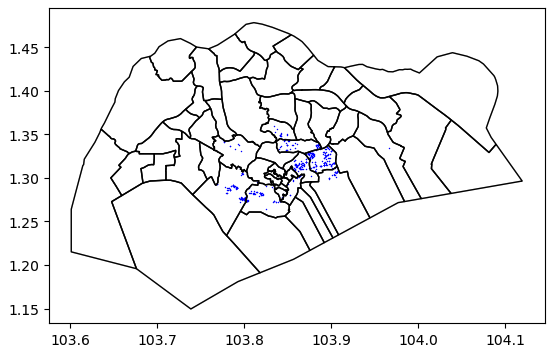
4. Plot the building pins on the polygon map
master_subzone.boundary.plot()
#Map to showcase the polygons and building pins
base = master_subzone.boundary.plot(linewidth=1, edgecolor="black")
points.plot(ax=base, linewidth=0.01, color="blue", markersize=1)
plt.show()
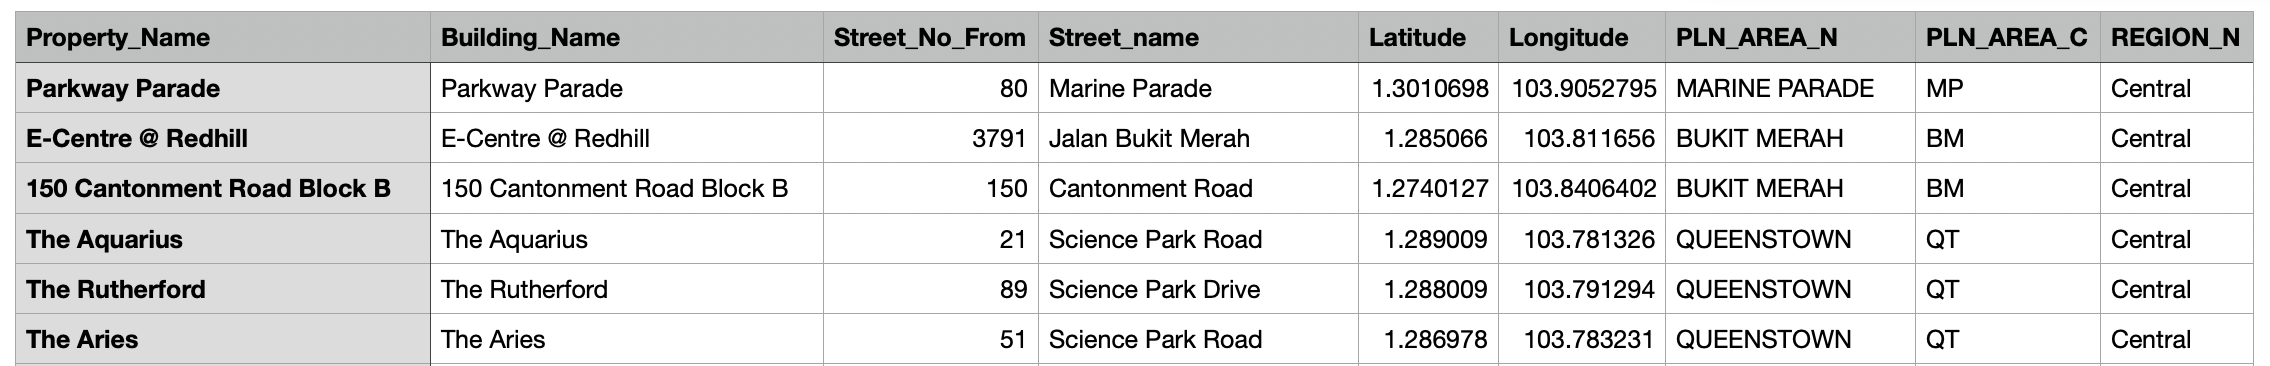
5. Export the final df with the required columns
#Defining the export file and dropping some unecessary columns
dfexport = pd.DataFrame(pointInPolys)
dfexport.drop(['coords', 'index_right', 'id', 'name','description','CA_IND','REGION_C','INC_CRC','FMEL_UPD_D'], axis=1, inplace=True)

#Mapping the Region column to fit better representation
dfexport['REGION_N'] = dfexport['REGION_N'].map({'NORTH-EAST REGION': 'North-East', 'WEST REGION': 'West', 'EAST REGION': 'East', 'NORTH REGION': 'North', 'CENTRAL REGION':'Central'})

#Export file to directory
filename = datetime.now().strftime('export_%H%M_%d%m%Y.csv')
path=r'C:\\Users\\weijin.ang\\Code\\'
dfexport.to_csv(os.path.join(path,filename), date_format='%Y%m%d', index=False)
Example output file:
With this automated code, you may add this as the final step in your ETL pipeline to get the Planning Area, Subzone, Region tags quickly and accurately for Singapore addresses!